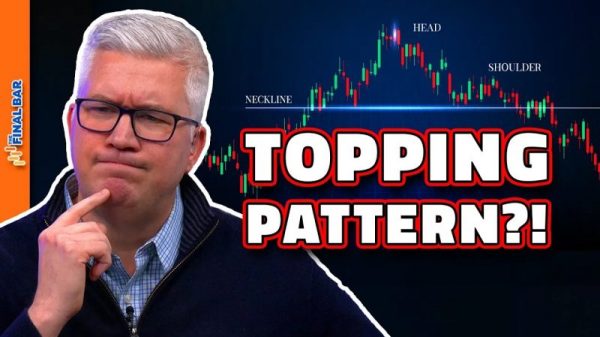


The S&P 500 is down 5.5% this month and volatility is rearing its ugly head. This is a good time to get some perspective by putting the move into context. My goal is to see the forest, as opposed to a few trees. First, we need to know if we are in a long-term uptrend or long-term downtrend. Once we know this answer, we can answer the second question. Is the current decline a primary or secondary move? Let’s start with the long-term trend.
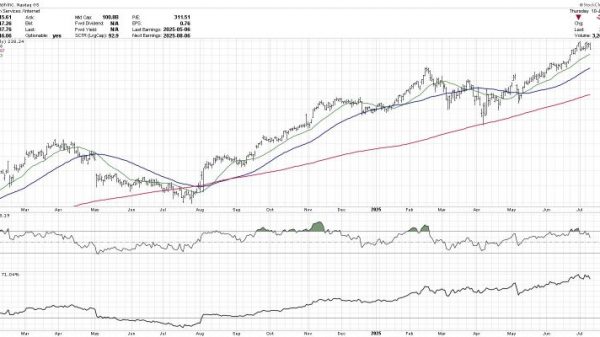
The chart below shows the S&P 500 with the 5-day SMA (green) and 200-day SMA (red). First, note that the index hit a new all time high in March. For those keeping score at home, this is less than a month ago! SPX is also well above the rising 200-day SMA and the 5-day SMA is 7.5% above the 200-day. These items suggest we are in a long-term uptrend.
The indicator window shows Percent Above MA (5,200) with signal lines at +3% and -3%. This indicator shows the percentage difference between the two moving averages. First, I am smoothing the close with a 5-day SMA. This smoothing significantly reduces the number of whipsaws, but there are still quite a few since 2022 (see the yellow ovals on the price chart).
For the signal filter, I am requiring the 5-day SMA to be 3% or more above/below the 200-day SMA for a signal. As the indicator shows, Percent Above MA turns green when the 5-day crosses above the 200-day and red when it crosses below. There were at least 17 crosses since late 2018. Applying the signal filter reduced the number of crosses to just six (red and green arrows). These thresholds filter out noise and short-term volatility. Note that this strategy turned bullish in early February 2023 and remains bullish. Percent Above MA is one of 11 indicators in the TIP Indicator Edge Plugin for StockCharts ACP.
Charles Dow notes that there are three types of price movements: primary, secondary and daily fluctuations. Based on the chart above, the primary move is up (long-term uptrend). SPY fell sharply in April and the secondary move is down. A secondary decline within a primary uptrend is a correction, and corrections within uptrends are opportunities. Nobody knows how long the correction will last or how far it will extend. Thus, marking future support is largely guesswork. Chartists would be better off focusing on price action and breadth, and looking for signs of improvement to suggest that the correction is ending.
TrendInvestorPro will analyze price action, 4-week High-Low Percent, Percent above 50-day and other breadth indicators to monitor this correction and time a reversal. This is part of our ChartTrader reports and videos. Our SystemTrader offering runs Dual Momentum Rotation Strategies for the Nasdaq 100 and S&P 500. After big gains in the first quarter, these moved into drawdown in April. Drawdowns are like corrections in that they provide opportunities. Click here to learn more and get immediate access.
Photo by Lukasz Szmigiel on Unsplash
//////////////////////////////////////////////////