


Novo Nordisk (NVO) reported Q1 earnings on May 2. Even though it was a positive report, sales of its weight-loss drug Wegovy came in below expectations, causing the NVO stock price to fall lower.
The selloff may have been an initial and short-lived reaction, as NVO pivoted and gapped up on Monday. Maybe investors realized that the stock was a bargain, given that overall sales are strong, as are sales of Ozempic, its diabetic drug.
The stock was filtered in the StockCharts Technical Rank (SCTR) crossing scan, which looks for stocks crossing above the 76, 79, and 80 levels. The logic behind the scan is to find stocks that are beginning to gain strength and could potentially be good candidates to add to your portfolio.
Novo Nordisk’s Technical Outlook
Follow the live chart.
Let’s analyze the charts of Novo Nordisk stock.
The five-year weekly chart of NVO below shows the stock is trending upward, particularly since October 2022.
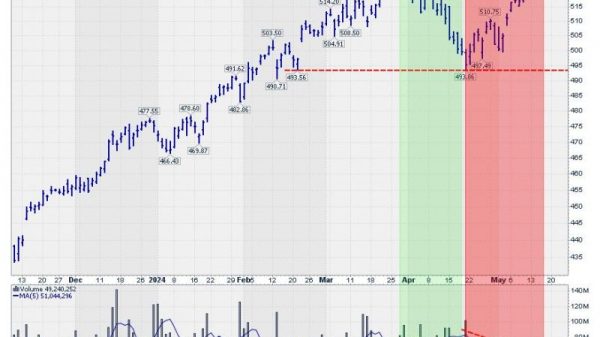
CHART 1. WEEKLY CHART OF NOVO NORDISK. The stock price has been trending higher and is now pulling back. Could it break out higher and reach its all-time high?Chart source: StockCharts.com. For educational purposes.
For the most part, NVO has traded above its 20-week simple moving average (SMA). The stock pulled back while the overall market was pulling back. What’s interesting in NVO’s pullback is that it started looking like a flag pattern, but then moved sideways.
Follow the live chart.
The daily chart below shows a more granular picture. The upward trend stalled, but recovered. The stock price is at its 50-day SMA with slightly higher volume.
CHART 2. DAILY CHART OF NOVO NORDISK. If the stock price moves above the 50-day moving average on strong follow-through, the price could reach and move above its all-time high.Chart source: StockCharts.com. For educational purposes.
The relative strength index (RSI) in the lower panel is slightly above 50, indicating that, if the stock moves higher, it has room to move before hitting overbought territory. The SCTR line in the top panel has crossed above the 70 line, another positive for the stock.
If NVO continues moving higher, accompanied by a rising RSI and SCTR, the odds of the stock price hitting its all-time high are good. If the upward price movement has strong follow-through, the stock could also hit new all-time highs.
With all stocks, you’ll have to look at the other side of the coin. What if NVO fails to hold the support of its 50-day SMA? It could fall to its 100-day SMA, which at this point coincides with previous support levels. If the SCTR dips below 50 and RSI moves below 30, the probability of an uptrend will reduce significantly.
The Takeaway
When you see a stock you like, it’s a good idea to add it to one of your ChartLists. All charts may not move in the direction you expect them to go, but the weekly and daily chart of NVO are worth watching. Novo Nordisk’s stock has potential to rise further and, if it does, your portfolio could get a nice boost.
SCTR Crossing Scan
[country is US] and [sma(20,volume) > 100000] and [[SCTR.us.etf x 76] or [SCTR.large x 76] or [SCTR.us.etf x 78] or [SCTR.large x 78] or [SCTR.us.etf x 80] or [SCTR.large x 80]]
Credit goes to Greg Schnell, CMT, MFTA.
Disclaimer: This blog is for educational purposes only and should not be construed as financial advice. The ideas and strategies should never be used without first assessing your own personal and financial situation, or without consulting a financial professional.