


Good morning and welcome to this week’s Flight Path. It was another strong week for U.S. equities as we saw S&P hit new highs on a week of strong blue “Go” bars. Treasury bond prices had a good weeks as well with a string of blue “Go” bars and the U.S. commodity index was able to remain in a “Go” trend although we did see some weakness with aqua bars as the week came to a close. The dollar was the only asset this week that fell out of its “Go” trend. We saw some uncertainty as price dropped and GoNoGo Trend painted a couple of amber “Go Fish” bars.
$SPY Paints Countertrend Correction Icon at New Highs
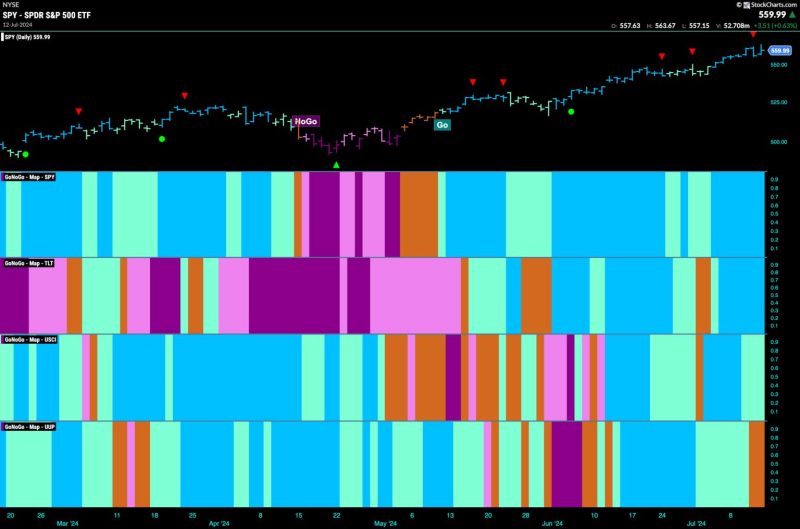
Equity prices continued higher this week and GoNoGo Trend painted uninterrupted strong blue “Go” bars. Late in the week we saw a Go Countertrend Correction Icon (red arrow) at the high indicating that price may struggle to go higher in the short term. When we look at the oscillator panel we can see that it fell out of overbought levels but has quickly returned showing sustained market enthusiasm. We will watch to see if momentum wanes this week and will look for price to consolidate at these new higher levels.
Strong “Go” trend. That is the reading from the weekly chart. Another higher weekly close on a strong blue “Go” bar is what we are seeing here. If we look at the oscillator panel we see that we are staying in overbought territory and so we do not see momentum falling off enough to trigger a countertrend correction icon (red arrow) on the price chart.
Treasury Rates in Strong “NoGo” Trend
This week confirmed the “NoGo” picture that had emerged. GoNoGo Trend painted a whole week of strong purple “NoGo” bars and price made a new lower low. When we look to the oscillator panel we can see that GoNoGo Oscillator fell back through the zero line after a few bars in a GoNoGo Squeeze and is now in negative territory at a value of -2. This tells us that momentum is resurgent in the direction of the “NoGo” trend and so we see a NoGo Trend Continuation Icon (red circle) on the price chart.
Dollar Displays Uncertainty
Last week GoNoGo Trend informed us that the “Go” trend was weak after it fell away from its most recent high and painted a number of weaker aqua “Go” bars. This week we saw price fall further, gapping lower mid week. This led to GoNoGo Trend painting a couple of amber “Go Fish” bars telling us that not enough of the GoNoGo criteria are being met to determine a trend in either direction. If we look to the GoNoGo Oscillator for clues, we can see that it has failed at zero, and is dropping fast toward oversold territory. There is negative momentum here.
The weekly chart still tells us that we are hanging on to the longer term “Go” trend. After a destructive week, we are trading close to levels that could well suggest support. As GoNoGo Oscillator falls toward the zero line, we will watch to see if it finds support at that level. If it does, we will expect the “Go” trend to continue.