


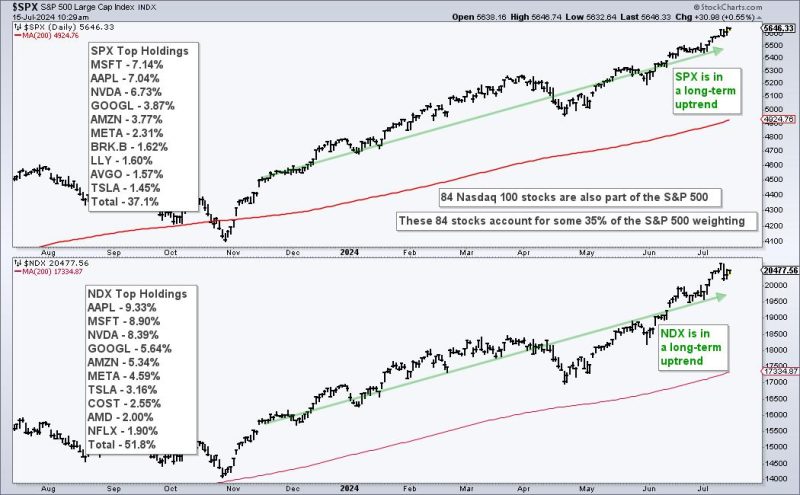
The Nasdaq 100 is a major driver in the stock market and Nasdaq 100 breadth indicators should be part of our broad market analysis routine. 84 Nasdaq 100 stocks (16.8%) are also in the S&P 500 and their weighting accounts for over 30% of the S&P 500. In fact, the six largest stocks in the S&P 500 come from Nasdaq 100 and account for 31.26%. The chart below shows the holdings for each index. Also note that both are in long-term uptrends.
Nasdaq 100 stocks also represent the risk appetite within the stock market. These stocks typically have higher growth rates and higher Betas. Chartists can track performance for Nasdaq 100 stocks using Nasdaq 100 specific breadth indicators. I want to trade Nasdaq 100 stocks and be fully invested when these indicators are bullish. I want to shun Nasdaq 100 stocks and raise cash when these indicators are bearish. We use a similar model for our Dual-Momentum Rotation Strategies at TrendInvestorPro. To this end, I am using three long-term breadth indicators to quantify Nasdaq 100 conditions. The chart below shows the percentage of Nasdaq 100 stocks above their 150 and 200 day SMAs as well as 52-week High-Low Percent. The latter is the percentage of 52-week highs less the percentage of 52-week lows.
All three indicators are long-term oriented and I am using bullish/bearish thresholds for signals. Divergences do not figure into my analysis because these are, more often than not, just distractions. Notice how QQQ advanced even as bearish divergences formed throughout 2024 (red arrow-lines). I will stick to the signals and ignore the nuance. NDX %Above 200-day SMA turns bullish with a move above 60% and stays bullish until a bearish signal triggers with is a cross below 40%. Adding signal thresholds above/below the midpoint (50%) reduces whipsaws. NDX %Above 150-day turns bullish with a move above 70% and bearish with a move below 30%. These thresholds are wider because the moving average is shorter. And finally, NDX High-Low Percent turns bullish with a move above +10% and bearish with a move below -10%.
Using all three indicators, chartists can take a weight of the evidence approach for assessing the Nasdaq 100. The bulls rule when two of the three indicators are on bull signals and the bears rule when two of the three are on bearish signals. A bearish signal triggered in January 2022 and a bullish signal triggered in early February 2023.
TrendInvestorPro recently introduced a market timing model based on long-term breadth indicators for the S&P 500 and Nasdaq 100. We published an extensive report and video describing this model and how it compares to models that use small-cap breadth. This model will be used for our Dual Momentum Rotation Strategy that trade Nasdaq 100 and S&P 500 stocks. Click here to subscribe and gain immediate access.
////////////////////////////////////////