


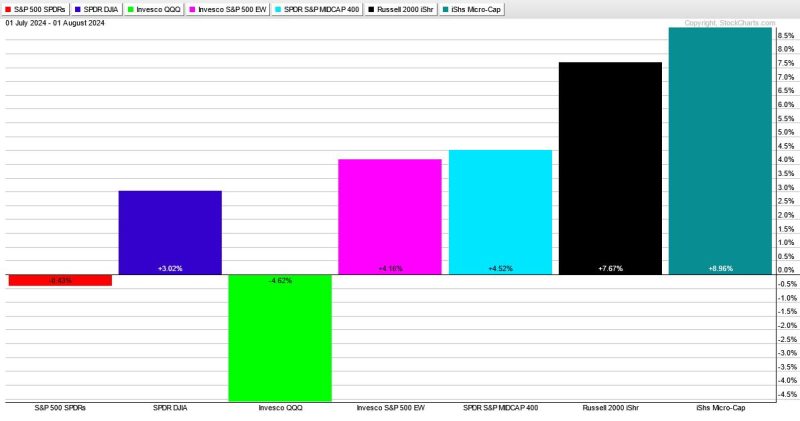
The broad market and the group are big drivers for stock performance. Recently, the Nasdaq 100 ETF (QQQ) led the market lower with sizable declines over the last five weeks. Weakness in QQQ weighed on tech stocks and tech-related industry groups, such as semis, software and cybersecurity. The PerfChart below shows QQQ down 4.62% since July 1st, SPY down a fraction and the Russell 2000 ETF (IWM) up 7.67%.
QQQ is in the midst of a pullback within a long-term uptrend. Chartists looking for opportunities in tech stocks and tech-related groups should wait for an oversold condition in the Nasdaq 100, which we are doing at TrendInvestorPro. We can identify oversold conditions using price oscillators and breadth indicators. I prefer breadth indicators because they aggregate performance for the average stock within the index.
The chart below shows QQQ with the Nasdaq 100 %Above 50-day SMA indicator in the lower window. First and foremost, QQQ hit a new high in July and remains well above the rising 200-day SMA. Thus, the long-term trend is up. This means the current pullback is a correction within this bigger uptrend.
NDX %Above 20-day SMA is a breadth oscillator that becomes oversold with a move below 10% (green shading). This means more than 90% of Nasdaq 100 stocks are below their 20-day SMAs. This is an oversold extreme that can pave the way for a bounce or breakout. It is important to wait for some sort of upside catalyst because stocks can become oversold and remain oversold. The blue arrow-lines show when this indicator surges above 70% (after becoming oversold). This shows a big increase in upside participation and acts as a bullish signal.
NDX %Above 20-day SMA has yet to become oversold and this means the correction in QQQ and tech stocks could continue. We are monitoring Nasdaq 100 breadth using an indicator that aggregates signals in seven short-term breadth indicators. The last oversold reading was in mid April and it has yet to become oversold. Click here to learn more.
//////////////////////////////////////////////////