


The 20+ Yr Treasury Bond ETF (TLT) is turning the corner as a long-term trend indicator turns bullish and price extends on a breakout. TLT is also starting to outperform the S&P 500 EW ETF (RSP), for the first time in a long time.
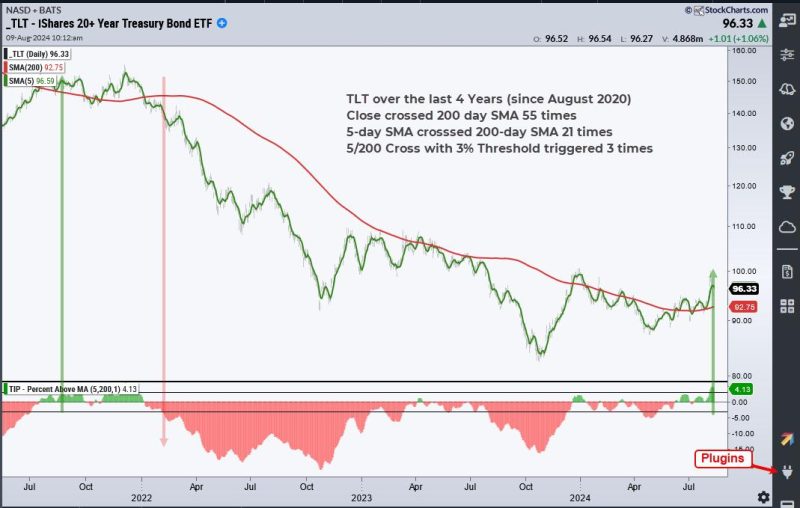
The first chart shows TLT with the 5-day SMA (green), the 200-day SMA (red) and the Percent above MA (5,200,1) in the lower window. This indicator shows the percentage difference between the 5 and 200 day SMAs. Note that I placed signal thresholds at +3% and -3%. This means I want the 5-day SMA to be at least 3% above/below the 200-day SMA for a signal.
We cannot totally eliminate whipsaws, but we can reduce them with smoothing and signal thresholds. In the window above, we can see the indicator turning green and red as the 5-day crosses above/below the 200-day. There were at 21 crosses over the last four years. There were only three crosses using the 3% signal thresholds. Note that a 3% signal triggers with a move above 3% and remains valid until a move below -3%. Percent above MA(5,200,1) exceeded +3% this week to signal the start of a long-term uptrend. Note that Percent above MA is one of 11 indicators in the TIP Indicator Edge Plugin (here).
As featured at TrendInvestorPro, the next chart shows TLT with some classic technical analysis at work, and a breakout to boot. First, TLT surged some 22% from late October to December. It then declined with a falling channel that retraced around 2/3 of this advance. TLT managed to hold well above the October low and break out of the channel. This higher low shows buying pressure stepping in at higher prices (above the October low). The breakout signals a continuation of the 22% advance and targets a move to the next resistance zone (109). Support is set at 90.
We are also seeing TLT outperform the S&P 500 EW ETF (RSP) for the first time in over a year. The indicator window shows the TLT/RSP ratio flattening out in spring-summer and breaking above its June high (red line). It also broke the 200-day SMA. Admittedly, the relative breakout is still a work in progress. The breakout on the price chart, however, looks solid.
We featured the breakout in TLT over a week ago and will continue to monitor it at TrendInvestorPro. This week we covered the significance of a surging VIX and widening yield spreads. We also covered deteriorating breadth and put forth a target zone for SPY going forward. Click here for immediate access.
//////////////////////////////////////////////////