


After Nvidia (NVDA) dropped after earnings this week, investors are once again reminded of the importance of the semiconductor space. I think of semis as a “bellwether” group, as strength in the VanEck Vectors Semiconductor ETF (SMH) usually means the broader equity space is doing quite well. Today, we’ll look at a potential topping pattern forming for the SMH, what levels would confirm a top for semiconductors, and what weakness in this key group could imply for our equity benchmarks.
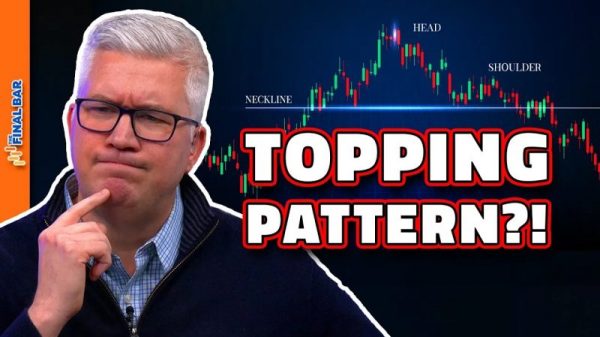
Presenting the Dreaded Head-and-Shoulders Top Pattern
Ralph Edwards and John Magee, in their classic text Technical Analysis of Stock Trends, laid out the analytical process for defining a head-and-shoulders top. I’ve found that any price pattern like this consists of three important phases.
First, we have the “Setup” phase, where the price action begins to take on the appearance of a certain phase. This is when your brain tells you, “This is definitely a head and shoulders topping pattern.” In this case, we’re looking for a significant high surrounded by two lower highs, creating the appearance of a head and two shoulders.
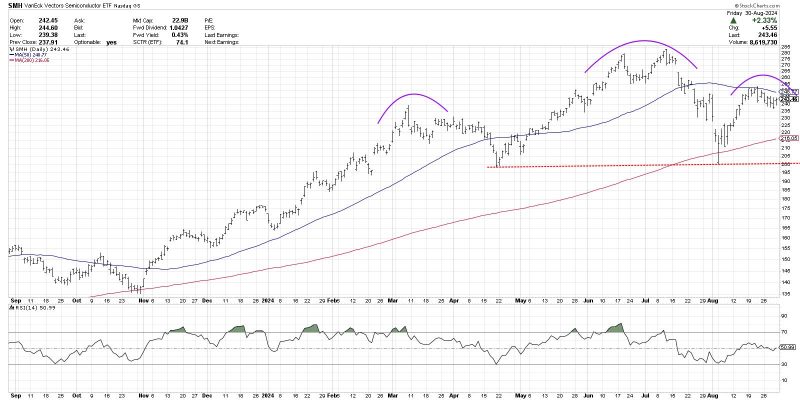
We can clearly observe the setup phase on the chart of the SMH, with the June and July highs forming a somewhat nontraditional, but still valid, head. The lower peaks in March and August complete the picture. It’s worth noting here that, in each of those peaks, we can see a bearish engulfing pattern, serving as a wonderful reminder for longer-term position traders: ignore candle patterns at your own risk!
What Would Confirm This Topping Pattern for Semis?
But the setup phase only means there is a potential pattern forming here. Next we need the “trigger” phase, where the price completes the pattern by breaking through a key trigger level on the chart. For a head-and-shoulders top, that means a break below the neckline, formed by drawing a trendline connecting the swing lows between the head and two shoulders.
Using the bar chart above, that would suggest a neckline around $200, over $40 below Friday’s close. Another school of thought involves looking at closing prices only, for a cleaner perspective and more simple measurements.
Using closing prices, we get an upward-sloping neckline which currently sits just below the 200-day moving average around $215. In either case, until we break below neckline support, this is not a valid head-and-shoulders topping pattern. The third phase, which I call the “confirmation” phase, involves some sort of follow-through beyond the breakout level. This could mean another down close after the break, or perhaps a certain percentage threshold below that support level. And once all three phases are complete, then we have a valid topping pattern.
Gauging Potential Broad Market Impact
So let’s assume that semiconductors do indeed complete the topping pattern. What would that mean for the broader equity landscape?
As of Friday’s close, the SMH is up about 38.2% year-to-date. That compares to the S&P 500 (SPY) at +18.9%, the Nasdaq 100 (QQQ) with +16.2%, and the equal-weighted S&P 500 (RSP) at +12.1%. So semiconductors have certainly been a stronger leadership group in 2024. But what about since the July market peak?
Now we can see that, while the S&P 500 is almost back to its July peak, the Nasdaq is still 4% below that day’s close and semis are a full 11% below the market peak in July. And the equal-weighted S&P 500 is actually above its July peak already, speaking to the strength that we’ve observed in non-growth sectors off the early August low.
There is no doubt that semiconductors are looking a bit vulnerable after Nvidia’s earnings this week. But given the strength that we’re seeing outside of the semiconductor space over the last two months, weakness in the SMH does not necessarily mean weakness for stocks. Remember that it’s always a good time to own good charts!
RR#6,
Dave
P.S. Ready to upgrade your investment process? Check out my free behavioral investing course!
David Keller, CMT
Chief Market Strategist
StockCharts.com
Disclaimer: This blog is for educational purposes only and should not be construed as financial advice. The ideas and strategies should never be used without first assessing your own personal and financial situation, or without consulting a financial professional.
The author does not have a position in mentioned securities at the time of publication. Any opinions expressed herein are solely those of the author and do not in any way represent the views or opinions of any other person or entity.