


At some point, this raging and relentless bull market has to slow down — right?!? And yet, as you’ll see from a quick review of three key market sentiment indicators, there could still be plenty of room for further upside in risk assets.
Today we’ll break down three of the market sentiment indicators I’m following to track a potential market top, and, along the way, I’ll share how a contrarian mindset could help investors navigate a volatile Q4!
Put/Call Ratio Hits an Extreme Low Reading
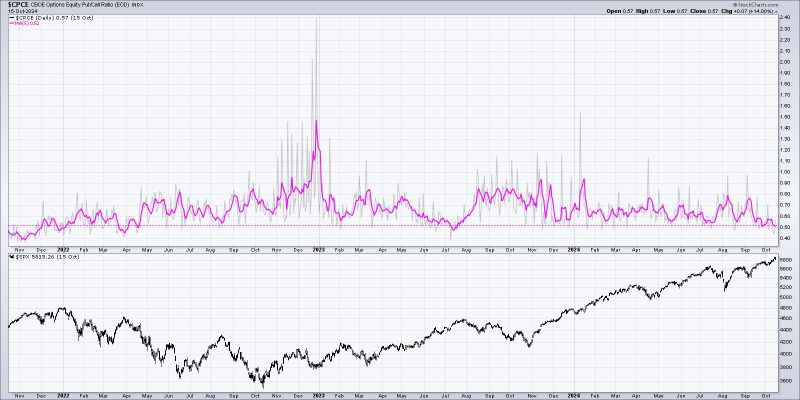
Let’s start with a measure of positioning in the options market, looking at the volume of put options (implying a bearish bet) vs. call options (indicating a bullish bet). I’m using the equity put/call ratio here, which ignores the volume in index options and focuses instead on individual stocks.
Since this is a fairly noisy data series, I’m showing the raw data in gray and smoothing out the day using a 5-day simple moving average in pink. You may notice that last week the raw data reached its lowest level since July 2023, indicating heavy bullish positioning. As a contrarian measure, this suggests to me that perhaps the options market is way too bullish as the S&P 500 pounds to new all-time highs.
AAII Survey Has Not Reached Euphoric Levels
While the put/call ratio has reached an extreme reading, I would not say the same for the AAII survey. This weekly survey of the members of the American Association of Individual Investors often becomes overheated toward the end of a bullish market phase, with the percent of bulls pushing above 50% of respondents.
Last Thursday’s reading came in just below that, registering a 49% bullish reading, with bears representing around 21% of the survey participants. So while there are way more bulls than bears, until the bullish reading pushes above 50%, I’m inclined to assume there could be more upside before I would label this as a “euphoric” reading. Note how most of the swing highs over the last 18 months have seen a bullish reading above 50!
NAAIM Exposure Index Implies More Upside Potential
While the AAII survey involves a group of individual investors, the NAAIM Exposure Index features responses from active money managers who are members of the National Association of Active Investment Managers. This survey asks for participants to share their current allocation to equities, and responses can range from -200% to +200%.
The latest reading here was around 90%, similar to the levels we’ve seen over the previous four weeks. If and when this indicator gets above 100%, implying respondents are leveraged long equities, I would consider the indicator to be in the euphoric range. And when indicators like this get to a level implying pretty much everyone is long equities, I begin to wonder whether a contrarian sell signal is right around the corner.
I love being able to combine different sentiment indicators into one “master” chart, so I can easily track their signals and look for confirmation across different technical approaches. With that in mind, I’ve created a Master Sentiment Chart to help identify if and when these indicators confirm a euphoric level as investors get a little too bullish.
Note that this is a weekly chart and provides a good overview of sentiment indicators. Be sure to review the daily charts for further detail, and remember that mindful investors recognize that price, breadth, and sentiment can and should be used together!
For more on these sentiment indicators and how I’m tracking their signals in October 2024, check out my latest video on StockCharts TV.
RR#6,
Dave
P.S. Ready to upgrade your investment process? Check out my free behavioral investing course!
David Keller, CMT
President and Chief Strategist
Sierra Alpha Research LLC
Disclaimer: This blog is for educational purposes only and should not be construed as financial advice. The ideas and strategies should never be used without first assessing your own personal and financial situation, or without consulting a financial professional.
The author does not have a position in mentioned securities at the time of publication. Any opinions expressed herein are solely those of the author and do not in any way represent the views or opinions of any other person or entity.