


As we get into the meat of Q3 earnings season, I’m seeing a growing and concerning number of signs of distribution in the equity markets. From lagging breadth indicators to deterioration of trend for the market leaders, we could be entering a painful period for risk assets! Let’s go through three different lenses through which we can make sense of the market environment in October 2024.
The S&P 500 is Holding Up (For Now)
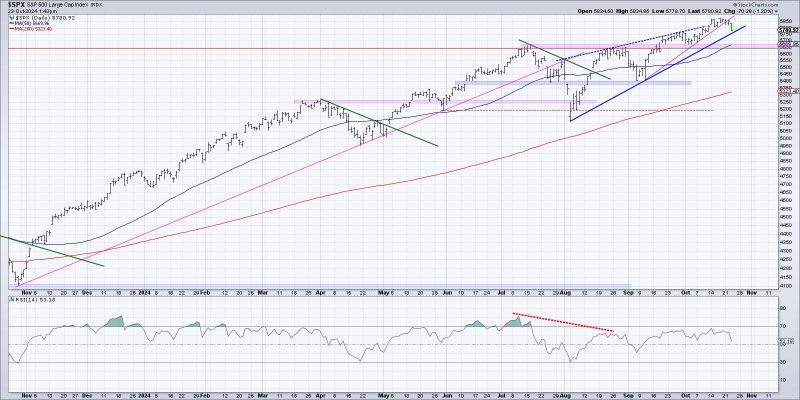
My daily S&P 500 chart shows how 2024 has looked and felt a great deal like 2021 or 2017, with a slow and steady uptrend and minimal drawdowns.
In this sort of environment, I go with the “line in the sand” approach, where I identify a key level or signal that would tell me the uptrend phase may be ending. A simple trendline using the August and September lows has provided a clear line in the sand going into October, and, as long as the S&P 500 remains above this trendline support, then the uptrend remains intact.
But as we’ve been tracking on my daily market recap show, CHART THIS with David Keller, CMT, the benchmark has been getting dangerously close to this trendline support in mid-October. So, while the 2024 uptrend remains intact, the end of the trend may be fairly close.
Breadth Indicators Showing a Bearish Divergence
What other approaches can help us anticipate when the end of the trend is near? Here, I’m showing the S&P 500 on a closing basis, along with two breadth indicators I review every single day.
The second panel includes the percent of S&P 500 members above their 50-day moving average, and the bottom panel displays the S&P 500 Bullish Percent Index. Notice how both of these breadth indicators have been sloping downwards in the month of October, while the S&P 500 has been trending higher?
This bearish divergence between the major averages and key breadth indicators tells me that, while many stocks still remain in primary uptrends, more and more are experiencing a price drop to the degree that they are either breaking below the 50-day moving average or generating a sell signal on their point & figure chart, or both!
MarketCarpet Speaks to Weakness in Mega-Cap Growth
Once I have a general sense of a broad market theme, I like to use the StockCharts MarketCarpet tool to better visualize how the various index members are moving in relation to the trend in the benchmarks.
Here’s the S&P 500 MarketCarpet from midday on Wednesday. Notice how some of the largest market cap names, including AAPL, NVDA, META, and AMZN, are glowing with some of the brightest red on the heatmap? When the “big dogs” are driving lower, our growth-dominated benchmarks have literally no chance to move higher.
As we push through earnings season into early November and elections, I’ll be watching the MarketCarpet every day to look for further signs of distribution. Because if the generals are struggling, the market as a whole could be in for a painful Q4.
RR#6,
Dave
P.S. Ready to upgrade your investment process? Check out my free behavioral investing course!
David Keller, CMT
President and Chief Strategist
Sierra Alpha Research LLC
Disclaimer: This blog is for educational purposes only and should not be construed as financial advice. The ideas and strategies should never be used without first assessing your own personal and financial situation, or without consulting a financial professional.
The author does not have a position in mentioned securities at the time of publication. Any opinions expressed herein are solely those of the author and do not in any way represent the views or opinions of any other person or entity.