


Toward the bottom of my Mindful Investor LIVE ChartList, there is a series of charts that rarely generate signals. So why would I include things like the Hindenburg Omen and Coppock Curve, which are usually a nonfactor during my regular chart review, in my main list of macro charts? Because I’ve learned that when these rare signals do actually occur, it’s best to pay attention!
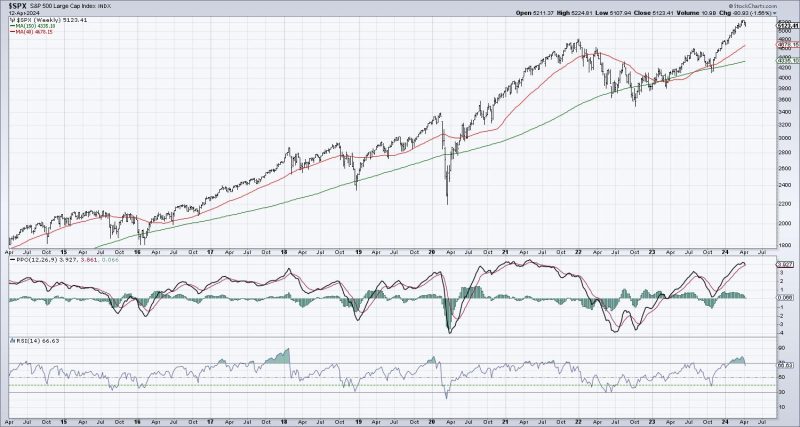
As I checked in on the markets this week during Spring Break, I noticed that the weekly S&P 500 chart showed that the RSI had just broken down out of the overbought region. And while the weekly PPO has not yet registered a sell signal, it finished the week by almost doing so.
At major market tops, you’ll usually see overbought conditions leading into peak, as prices move aggressively higher in the later stages of the bull market. The weekly RSI (bottom panel) pushed above the 70 level in mid-January, and has remained above that threshold until this week.
The weekly PPO is an adaptation of Gerald Appel’s fantastic MACD indicator, which uses a series of exponential moving averages to identify the primary trend and indicate trend reversals. If we would get a confirmed sell signal next week, with the PPO line crossing down through the signal line, that would be the first signal since the market peak in August 2023.
Let’s bring in some additional price history to consider how often this dual sell signal has triggered, and what has usually followed this bearish confirmation.
This pattern has occurred ten times since the 2009 market bottom, with five of those signals resulting in some of the most meaningful drawdowns of the last 15 years. The other five times ended up being fairly brief pullbacks within a longer-term uptrend.
How can we differentiate the winning signals from the less successful indications? Well, the winning signals were followed soon after by a break of the 40-week moving average, used on the weekly chart to emulate the 200-day moving average from the daily chart.
During the false sell signals, we never saw a confirmed break below the 40-week moving average, as buyers seemed to come in to buy on weakness and push prices back higher. Looking forward to the coming weeks, that would mean that an S&P 500 below 4680 or so would indicate a high likelihood of much further downside for stocks.
It also tells me to focus in on other macro technical indicators, using breadth indicators and the daily S&P 500 chart to further validate the short-term price momentum.
S&P 5050 remains a key short-term support level, as this served as a key pivot point in February and March. As the SPX has begun an apparent rotation down to this support level, it’s worth noting that the daily RSI is now below 50. The percent of stocks above the 50-day moving average is now below 50%, and the McClellan Oscillator is well below the zero level.
All of these short-term signals speak of a market in a corrective phase. If and when the S&P 500 would break below its 200-day moving average (less than 500 points away after Friday’s close!), that would mean the short-term deterioration has fueled enough of a breakdown to trigger our weekly sell signals.
In either case, I’ve seen enough after this week’s overheated inflation numbers to consider a much stronger downdraft as we enter the meat of earnings season. Whatever you think may come next for the S&P 500 and Nasdaq 100, now could be a perfect time to make sure you have a good exit strategy in mind!
RR#6,
Dave
P.S. Ready to upgrade your investment process? Check out my free behavioral investing course!
David Keller, CMT
Chief Market Strategist
StockCharts.com
Disclaimer: This blog is for educational purposes only and should not be construed as financial advice. The ideas and strategies should never be used without first assessing your own personal and financial situation, or without consulting a financial professional.
The author does not have a position in mentioned securities at the time of publication. Any opinions expressed herein are solely those of the author and do not in any way represent the views or opinions of any other person or entity.