


Small-caps took the lead over the last two weeks with the S&P SmallCap 600 SPDR (IJR) surging over 10% in five days and hitting a new high. IJR also broke out of a long consolidation and this breakout is bullish. There are now three possibilities going forward. First, IJR continues higher without looking back. Second, IJR tests the breakout zone with a throwback. Third, IJR fails to hold its breakout and turns bearish. Let’s look at the current chart and some prior breakouts for insights. We covered the recent setups and breakouts in small-caps, mid-caps and non-tech stocks in our reports and videos at ChartTrader (here).
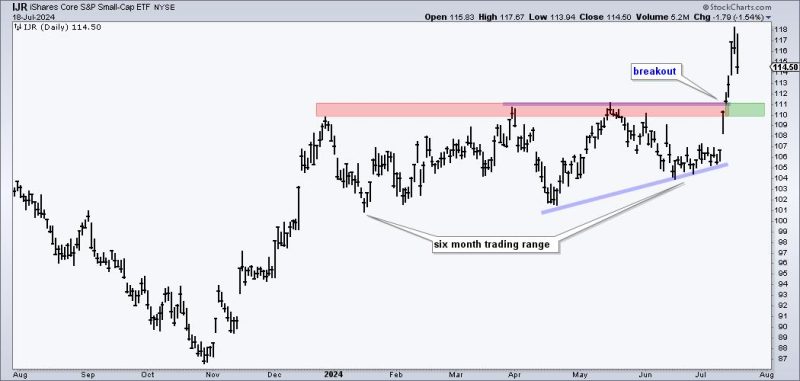
The first chart shows the current situation. IJR surged with the broader market from late October to December and then embarked on a six month trading range. As we will see, IJR is no stranger to long, and frustrating, trading ranges. IJR formed an ascending triangle in the second half of this range and broke out with a big surge the last two weeks. This breakout is bullish and a strong breakout should hold. A close below 109 would erase more than half of this surge and call for a re-evaluation.
The next chart shows IJR with a breakout that failed to hold. After a big advance from November to March, IJR embarked on a seven month trading range. A symmetrical triangle (blue lines) formed in the second half and the ETF broke out with a big move in November. A strong breakout should hold with broken resistance turning into the first support zone. IJR did not hold this breakout as it gapped below the breakout zone in late November. This gap and sharp decline through the breakout zone were the first signs that something was wrong.
The next chart shows IJR with a breakout and continuation higher. IJR bottomed in March 2020 and advanced until early June. The ETF then embarked on a five month trading range that lasted until October. A classic cup-with-handle formed (blue lines) in the second half and IJR broke out with a gap-surge in November. The ETF never looked back and advanced over the next three months. This is the strongest scenario for a breakout, but we are not seeing this as IJR fell 2% the last two days.
There are two key takeaways. First, IJR and small-caps can and do get stuck in trading ranges. They go through trending periods, but are also prone to extended periods of sideway price action. Second, a strong breakout should hold and the breakout zone is the first area to watch going forward. Be careful if we see a sudden and sharp decline back through the breakout zone.
ChartTrader reports and videos covered setups in the S&P MidCap 400 SPDR (MDY) and S&P 500 EW ETF (RSP) in late June and updated these charts with our analysis this week. We also featured a number of non-tech stocks with bullish continuation patterns and breakouts. Click here to learn more.
//////////////////////////////////////////////////