


Mid-caps show leadership and were the first to trigger a breadth thrust. Stocks surged this week with mid-caps showing the highest participation rate. Chartists can quantify the participation rate and identify breadth thrusts using the percentage of stocks above their 20-day SMAs. We will analyze these indicators for six broad indexes and show the breadth thrust for the S&P MidCap 400.
Chart Link
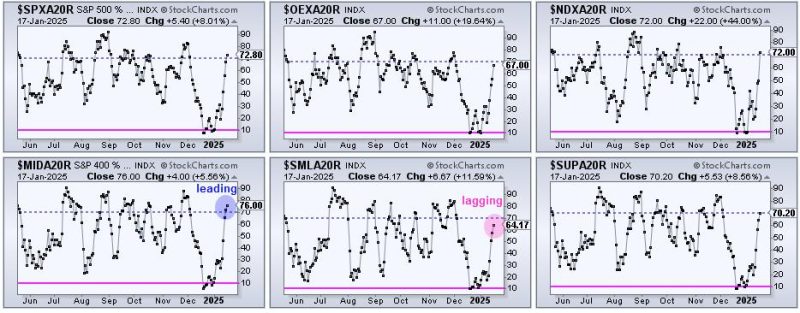
The CandleGlance charts above show the percentage of stocks above their 20-day SMAs for the S&P 500, S&P 100, Nasdaq 100, S&P MidCap 400, S&P SmallCap 600 and S&P 1500. We can identify the leaders and the laggards by comparing values. Mid-caps are leading as S&P MidCap 400 Percent Above 20-day SMA ($MIDA20R) surged to 76 percent (blue circle), the highest of the six. This means 76 percent of its component stocks are above their 20-day SMAs. This is a big change because this number was below 10% in mid December. Small-caps are lagging as $SMLA20R finished at 64.17 percent (pink circle). Everything else is in between.
Chart Link
The chart above shows S&P MidCap 400 Percent Above 20-day SMA ($MIDA20R) in the top window with the oversold line at 10 percent (pink) and the thrust line at 70 percent (blue). This indicator formed a bullish divergence and then triggered a breadth thrust on Thursday. A move below 10 percent marks a downside extreme that signals an oversold condition (pink shading). Stocks, however, can become oversold, and remain oversold. Therefore, we need to wait for an upside catalyst. A subsequent move above 70% (blue dashed lines) shows a participation thrust, which means the vast majority of component stocks participated in this advance. Broad participation is bullish. $MIDA20R was the first of the six to cross above 70 percent.
At TrendInvestorPro, we pointed out oversold breadth in December and featured the divergence in Tuesday’s report. A divergence forms when the underlying index ETF (MDY) forges lower lows and the indicator forms higher lows (blue lines). MDY fell from mid December to mid January (lower lows), but fewer stocks within the index moved below their 20-day SMAs during this timeframe. Put another way, more stocks held above their 20-day SMAs. Divergences in March and October 2023 also preceded breadth thrusts.
This week at TrendInvestorPro we covered six Market Regime charts on Wednesday and highlighted seven leading ETFs om Friday’s report/video. Leadership is coming from the middle of the market, and specifically from three sectors. Click here to take a trial and get immediate access.
/////////////////////////////////////////////////