
Stock
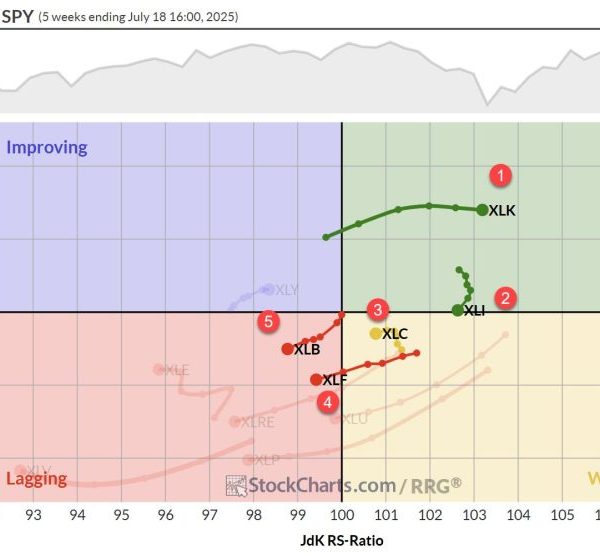
Sector Rotation Stalls, Tech Remains King Despite a slight rise in the S&P 500 over the past week, the sector rotation landscape is presenting...
Hi, what are you looking for?

Allied Critical Metals Further Highlights Rapid Payback, Capital Efficiency and Infrastructure from Borralha PEA

Crypto Market Update: Strait of Hormuz Fears Rattle Crypto Markets

Top 5 Canadian Mining Stocks This Week: Adex Mining Extends Gains with 100 Percent Jump

WPIC: Platinum Market Heading for Fourth Straight Deficit in 2026
BHP: Targeted AI Platforms Boost Efficiency, Safety and More

The practical and moral difficulties of deporting millions draw closer

Trump supporters are more likely to expect a collapse into fascism

Wrong-way driver passes Harris motorcade on Milwaukee highway

Trump meets definition of ‘fascist,’ says John Kelly, his former chief of staff

American creating deepfakes targeting Harris works with Russian intel, documents show

United Airlines says it will boot passengers who refuse to use headphones on planes

DOJ takes Live Nation-Ticketmaster to court for antitrust trial

L.A. County sues Roblox, alleges platform makes it easy for adults to target children

CFTC chief sides with prediction markets over state regulators in a high-stakes court case

Justice Department’s antitrust chief says she’s leaving, effective immediately

Desperate Gaza doctors cram several babies into one incubator as fuel crisis reaches critical point

Deadly strikes on Kyiv as Russia continues ferocious bombardment of Ukraine for second night

Trump praises ‘good English’ of Liberian president, prompting criticism across Africa

Does Putin hit back when Trump criticizes his ‘bullsh*t?’

At least four killed and many ‘kidnapped’ in second Houthi attack in a week on Red Sea cargo ship


Even with a few short-lived roller coaster rides, the stock market had a strong week. Though there was some selling on Friday, the S&P...
Sector Rotation Stalls, Tech Remains King Despite a slight rise in the S&P 500 over the past week, the sector rotation landscape is presenting...
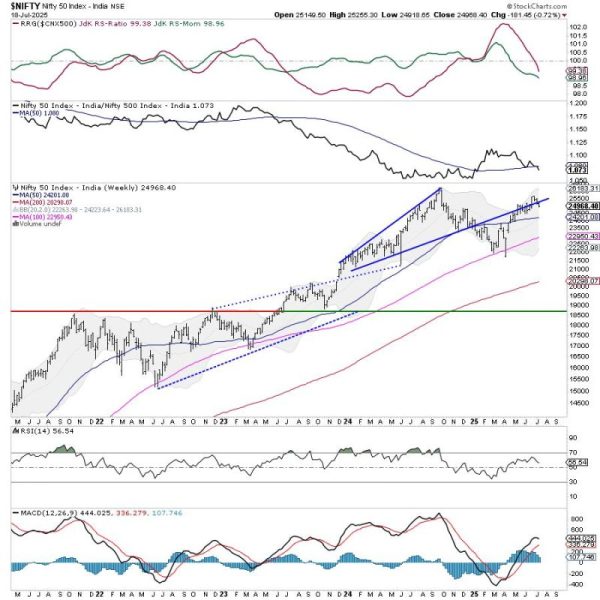

The Nifty traded in a broadly sideways and range-bound manner throughout the previous week and ended the week with a modest decline. The Index...


In this video, Mary Ellen spotlights the areas driving market momentum following Taiwan Semiconductor’s record-breaking earnings report. She analyzes continued strength in semiconductors, utilities,...
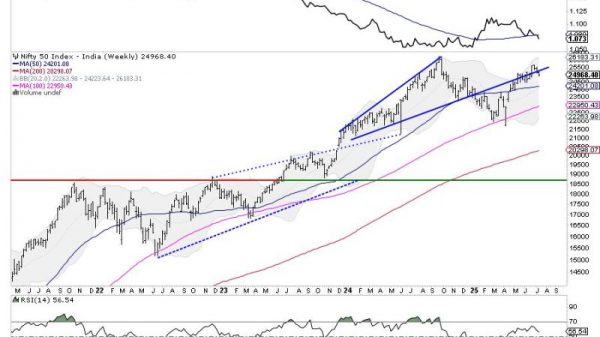


Sector Rotation Stalls, Tech Remains King Despite a slight rise in the S&P 500 over the past week, the sector rotation landscape is presenting...


Even with a few short-lived roller coaster rides, the stock market had a strong week. Though there was some selling on Friday, the S&P...
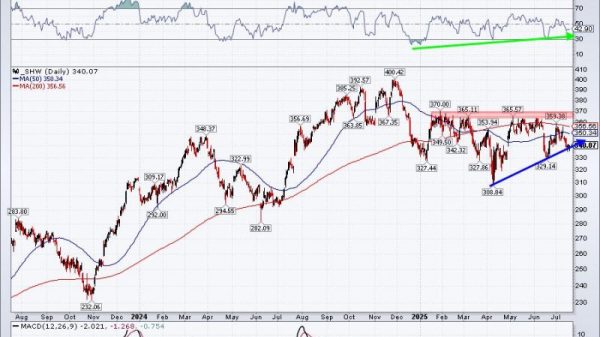

This week, let’s dive into three interesting stocks: a well-known Dow stalwart, a tech giant in a tug of war, and a former Dow...


In this video, Mary Ellen spotlights the areas driving market momentum following Taiwan Semiconductor’s record-breaking earnings report. She analyzes continued strength in semiconductors, utilities,...


One great habit to develop as an investor is regularly scanning the stock market. Whether you’re checking for stocks that are outperforming a benchmark,...


Join Tom as he covers key inflation data, earnings season highlights, and sector rotation trends. He breaks down recent price action in major indexes...

There is no denying that the broad markets remain in a resilient uptrend off the April 2025 low. But if there’s one thing I’ve...