
Stock
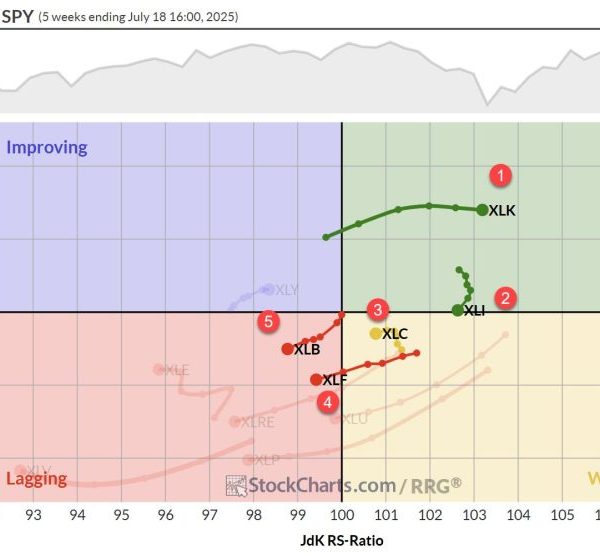
Sector Rotation Stalls, Tech Remains King Despite a slight rise in the S&P 500 over the past week, the sector rotation landscape is presenting...
Hi, what are you looking for?

LAURION Strengthens Team with Appointment of Capital Markets and Mining Specialist Sean Ghosal as Strategic Advisor

Boundiali extends strike and depth at BDT3 and BST1

Editor’s Picks: Gold, Silver Prices Dip and Bounce Back, Plus Top Takeover Candidate

Albemarle Lifts Lithium Demand Forecast as Energy Storage Surges

Sirios Resources: Advancing a Multi-million-ounce Gold Project in Québec’s James Bay Region

The practical and moral difficulties of deporting millions draw closer

Trump meets definition of ‘fascist,’ says John Kelly, his former chief of staff

Trump supporters are more likely to expect a collapse into fascism

Wrong-way driver passes Harris motorcade on Milwaukee highway

American creating deepfakes targeting Harris works with Russian intel, documents show

Justice Department’s antitrust chief says she’s leaving, effective immediately

Cardi B’s cameo in Bad Bunny’s Super Bowl halftime show leads to dispute on prediction markets

Retail operator of outdoor sportswear pioneer Eddie Bauer files for bankruptcy

Landmark trial accusing social media companies of addicting children to their platforms begins

Trump administration alleges Nike discriminated against white workers

Desperate Gaza doctors cram several babies into one incubator as fuel crisis reaches critical point

Deadly strikes on Kyiv as Russia continues ferocious bombardment of Ukraine for second night

Trump praises ‘good English’ of Liberian president, prompting criticism across Africa

Does Putin hit back when Trump criticizes his ‘bullsh*t?’

Universities threatened with funding cuts under proposed plan to tackle antisemitism in Australia


Even with a few short-lived roller coaster rides, the stock market had a strong week. Though there was some selling on Friday, the S&P...
Sector Rotation Stalls, Tech Remains King Despite a slight rise in the S&P 500 over the past week, the sector rotation landscape is presenting...
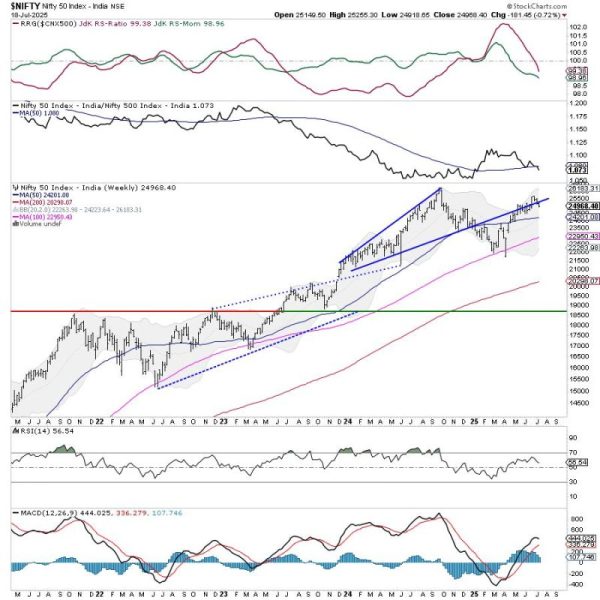

The Nifty traded in a broadly sideways and range-bound manner throughout the previous week and ended the week with a modest decline. The Index...


The market rebounded to start trading on Monday, but indicators on Friday suggest internal weakness. Carl gives us his latest analysis on the market...
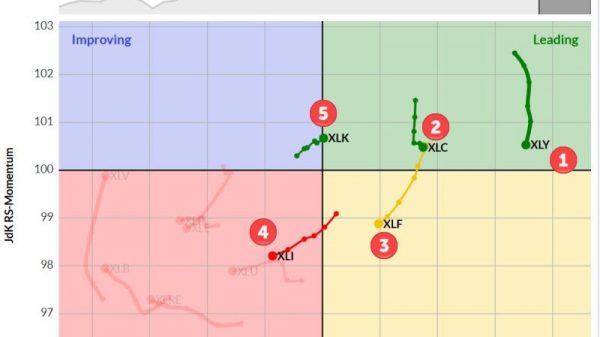

No Changes In Top-5 At the end of the week ending 2/7, there were no changes in the top-5, but there have been some...

In this video, Mary Ellen reviews the market’s flat momentum as uncertainty reemerges after weak AMZN, TSLA and GOOGL reports – PLUS more tariff...


The trading week started with investors worried about tariffs, but the 30-day delay of tariffs on imports from Canada and Mexico shook off those...
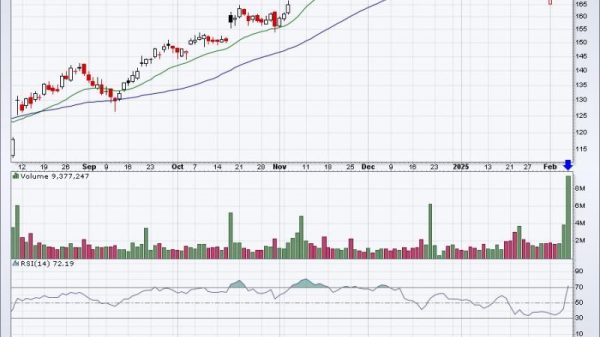

Sometimes an industry group looks good technically, sometimes fundamentally, and then other times seasonally. But what happens when they all line up simultaneously? Well,...
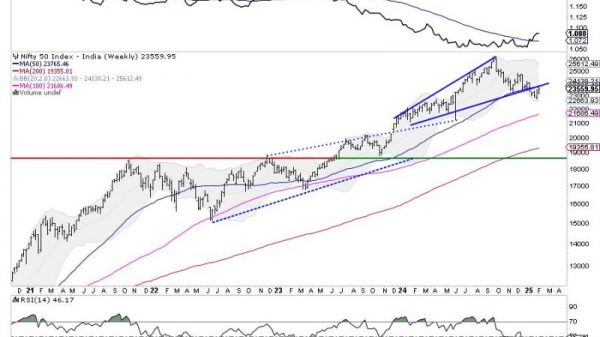
In what can be called an indecisive week for the markets, the Nifty oscillated back and forth within a given range and ended the...


In this video, Mary Ellen reviews the market’s flat momentum as uncertainty reemerges after weak AMZN, TSLA and GOOGL reports – PLUS more tariff...


The trading week started with investors worried about tariffs, but the 30-day delay of tariffs on imports from Canada and Mexico shook off those...


In what can be called an indecisive week for the markets, the Nifty oscillated back and forth within a given range and ended the...


The trading week started with investors worried about tariffs, but the 30-day delay of tariffs on imports from Canada and Mexico shook off those...